Wednesday, September 11, 2024

Mexico mining industry takeover & Ban on open-pit mining - Satori Traders

 Mexico mining industry takeover & Ban on open-pit mining

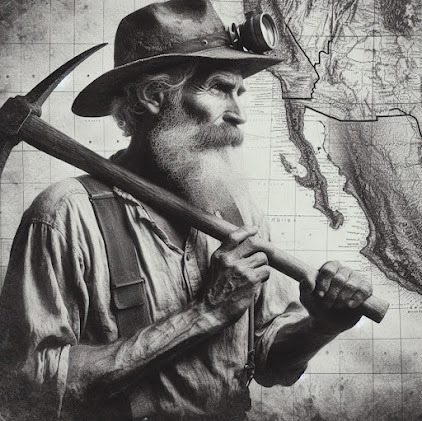
In today's video, we dig into Mexico mining law and the recent changes made in 2023. These legal changes are significant because Mexico is one of the few tier one jurisdictions for mining companies and, if all of the legal changes get cemented permanently into law, Mexico may stop being a preferred location for mining operations.

Although the 2023 Mining Reforms have now been passed into law, there are at least 500 legal cases disputing these reforms. Mexico doesn’t allow class action law suits so each aggrieved party has to file their own suit.

My objective in this presentation is to answer two questions:

  • Is it okay to invest in mining companies in Mexico?
  • Will Mexico ban open pit mining?

As an investor with a Portfolio of Silver and Gold mining stocks, these questions are relevant to how I manage my existing holdings and how I invest going forward.

Mexico mining industry - Different perspectives

As I was performing research for this video it occurred to me that there are multiple perspectives on mining in Mexico. Each of these perspectives color how an individual views the 2023 Mining Reforms and whether the new laws should remain in place:

  • Investors in physical silver
  • Existing mining companies
  • Prospective mining companies
  • Environmentalists
  • Native peoples
  • Citizens living in close proximity to mining operations

Investors in physical Silver

I'm primarily an investor in physical Precious metals and Silver in in particular. You could say that I'm a huge Silver bug. From my perspective, it is OK if they stop all mining in Mexico. That only helps my position because the value of the metal that I hold would increase due to the reduction in supply.

Twenty-four percent of the Silver mined in the World comes out of Mexico. Stopping this production, or even curtailing it significantly, would almost certainly drive the price of Silver higher.

Existing mining companies

As operators of existing mines, it is understandable that they would want to see the Mexico mining industry remain unchanged. The legal changes made in 2023 will reduce their profits and potentially put their entire operation at risk.

This perspective became clear to me when listening to a mining company CEO speaking to his investors and prospective investors. He was trying to minimize the impact of the Mining Reforms – essentially telling investors that the Reforms would not affect business operations. Given his position, this perspective makes sense - without investors his business will wither and die.

Prospective mining companies

Based on my research prospective mining companies in Mexico will be most impacted by the 2023 Mining Reforms.

Their business model is to go into Mexico, identify a prospective mining concession and obtain clear, unencumbered title to the concession. With title in hand, they can then start the exploration process that will hopefully lead to a successful and profitable mining operation.

The 2023 amendments to existing mining laws effectively nationalize the exploration phase of mineral mining in Mexico. This means that prospective mining companies can only participate in the development and extraction phases.

Environmentalists

Environmentalists, at least the extreme ones, have a perspective similar to myself as an investor in physical Precious metals. They would like to see the entire Mexico mining industry shutdown.

While their perspective is understandable, it is rather short-sighted.

The modern high-tech world that we live in depends on the extraction of resources from the ground – no resources, no tech – the relationship is fairly simple.

For example, Silver locked up in rock in the ground doesn't do much for us. However, if we pull that Silver out of the ground and refine it, we can then use it for Silver solder in electronics, silicon wafers in solar panels, high-performance batteries, etc.

Silver is the most conductive metal on the planet as well as the most reflective metal on the planet. Its uses are manifold and there aren’t any good substitutes to use as an alternative.

Native peoples

It doesn't matter which country we choose to talk about, Native peoples tend to get the short end of the stick, so to speak. This unfortunate reality is no different in Mexico.

As a result, it isn’t surprising that the Native Peoples in Mexico have a unique perspective on the 2023 Mining Reforms. Basically, they want a seat at the table. They want to benefit from the minerals that are mined in the lands that they consider to be theirs.

Citizens living in close proximity to mining operations

Mexican citizens living close to mining operations have another perspective.

They want to benefit from the high-paying jobs available at the mine but they don’t want their water supplies to be poisoned, and they don’t want to go thirsty because the mining operation is using up all of the available water.

I found these different perspectives on the issue of mining in Mexico to be interesting. As I show in the video, the 2023 Mining Reforms are beneficial for some and detrimental for others, depending on their perspective.

Mexico mining industry overview

These are the key topics discussed in the video.

Why mine in Mexico?
What is the extent of mineral extraction in Mexico?
How has mining law changed in Mexico
Proposed changes to mining law in Mexico
Potential impact of ban on open-pit mining in Mexico

Executive summary of the video presentation

  • Mining laws in Mexico changed dramatically in 2023
  • These changes increase the cost and risk of mining in the country
  • There is potential for additional legal changes that may include a ban on open-pit mining
  • The Mining Reforms are being challenged in the Mexican legal system
  • The legal changes affect new exploration more than existing operations
  • Investment in the Mexico mining industry has dropped by 60% since the Reforms were passed into law

Why mine in Mexico?

1) That's where the metal is

If you want to mine Silver, Mexico will probably be near the top of your list based on the amount of Silver that has been mined there in both historic and modern terms.

Mexico is the largest producer of Silver in the World by a wide margin. The country is also a significant producer of Gold, Copper, and Zinc.

This is the primary reason Mexico Silver mining companies choose to operate in the country.

2) Less regulation

The second reason for mining in Mexico is that there is less regulation of the chemicals and pollutants that are commonly used in the mining industry.

In the United States there are 675 different pollutants regulated, in Canada the number is 346, while in Mexico it is only 104.

3) Cheap labor

It would probably be more politically correct to speak of ‘less expensive labor’ but, regardless of the term you choose to use, labor costs are lower in Mexico than in either Canada or the United States.

What is the extent of mineral extraction from Mexico?

Mexico produces:

  • 24% of global Silver supply (#1 producer - China is #2 at 13.2%)
  • 2.7% of global Gold (#6 producer)
  • 3% of global Copper (#11 producer)
  • 7% of global Zinc (#5 producer)

The Mexico mining industry generates 2.4% of Mexico’s GDP. Analysts expect the country’s GDP to drop by 1% due to the 2023 Mining Reforms.

How has mining changed in Mexico?

This timeline shows the changes that have occurred in the Mexico mining industry in recent years:

  • 2018 President Obrador, commonly referred to by his initials, AMLO, stops granting mining concessions after taking office
  • 2022 Lithium Reforms – Mexico nationalizes Lithium and establishes a state-owned company to manage the exploration, mining, and refining of the strategic metal
  • 2023 Mining Reforms – these changes to Mexico mining law are the focus of the video presentation
  • 2024 ban on open-pit mining (?) – AMLO proposed this radical change in February, 2024 and President-elect Claudia Sheinbaum has stated that she intends to implement all of the reforms that AMLO has initiated

These changes, when viewed together, show a trend towards more government control and regulation of the mining industry. They also demonstrate a potential trend towards nationalizing all mineral resources in Mexico (keep in mind that petroleum resources were nationalized in 1938).

How has the Mexico mining industry changed?

This is a high-level list of the most significant 2023 Mining Reforms:

  • Restrictions on the granting of new mining concessions
  • Shortening of the duration of mining concessions
  • Separation of water concessions from mining concessions
  • Restricting mining concessions to a single mineral
  • Allocating 5% of net profits to native peoples
  • Reducing the ability to pledge a mining concession as an asset to secure financing
  • Making mining companies criminally liable for accidents and injuries
  • Adding provisions to cancel or revoke mining concessions

These reforms have been enacted but there is still a great deal of uncertainty about them. For example, one of the changes requires that a new government agency be created, but that agency hasn't been created a full year after the law was enacted.

As investors and potential investors, uncertainty is not a good thing. If you are uncertain about the future of mining in Mexico, you're not going to make an Investment. This is true for both mining companies and for individuals who invest in mining companies.

Wrapup

In the video we walk through each of the changes listed above and discuss them in-depth. We finish by answering the two questions that we started with:

  • Is it okay to invest in mining companies that operate in Mexico?
  • Will Mexico ban open pit mining?

Watch the video for an in-depth discussion of the 2023 Mining Reforms and to discover whether Mexico will ban open pit mining.

https://satoritraders.com/blog/mexico-mining-industry-takeover-ban-on-open-pit-mining

Tuesday, September 10, 2024

Dolly Varden Silver - Dilution of shares - Cash burn rate - Satori Traders

Dolly Varden Silver - Dilution of shares - Cash burn rate

How-to-buy-Dolly-Varden-Silver-stock-Satori-Traders.png

In today’s video we perform a deep-dive into Dolly Varden Silver Corp (TSX-V: DV) (OTC: DOLLF).

Dolly Varden is an exploration company focused primarily on finding Silver resources in the Golden Triangle of British Columbia.

We start our report by stating that DV has reached a market capitalization of $310 (CAD) million which is the threshold where we like to see a company moving decisively towards production.

In other words, $300 million is where an exploration company is fully valued in our opinion. Unless the explorer is decisively moving towards production or a buyout, it is time to evaluate whether remaining invested makes sense.

Because Dolly Varden hasn’t announced any plans to go into production and it isn’t obvious that a near-term buyout is likely, we wanted to perform this deep dive and look at the company’s financial picture.

In particular, we had two questions that we wanted to answer:

  • How many shares of Dolly Varden are being issued into the market? (dilution rate)
  • What is the annual burn rate of cash that the company is experiencing? Because DOLLF has zero revenue at this point, the cash burn can only be paid for by selling shares (i.e., this question is closely related to the first question).

As part of determining the burn rate for cash, we took a close look at the compensation of the CEO, CFO, and Technical advisor. Performing this part of our analysis required unravelling several footnotes in the itemized expenses provided in the Management’s Discussion and Analysis reports.

Highlights from a February 14, 2024 recorded interview with the CEO

  • Dolly Varden continues to be a tightly-held company with only 25 million shares available in the public float
  • The company is debt free and has significant cash on hand ($9.5 million CAD at the time of the interview - $40 million CAD as of September 4, 2024)
  • Having cash on hand is unique for a junior mining company at this time because financing is hard to come by
  • Climate changes are causing glaciers to recede in the Golden Triangle so the potential for discovering new resources is increasing
  • Because of the high-grade resources that Dolly Varden has proven through its drill programs, the company that eventually puts these resources into production will have the potential to be a low-cost producer (notice that this is a hint that the CEO, Shawn Khunkhun, does not intend to take Dolly Varden into production)
  • Instead of grams per ton resources, Dolly Varden resources are measured in kilograms per ton
  • When the CEO purchased the company 4 years ago it was value at $0.37 per ounce of Silver in the ground
  • The current value of DV’s resources is $1.00 per ounce in the ground
  • At the height of the Precious metal Bull Market in 2010, Silver companies were being valued at $3.50 per ounce in the ground
  • Because of inflation, Mr. Khunkhun believes that resources will be valued at a price higher than $3.50 per ounce during the next Bull Market
  • The current resources (Indicated and Inferred) are being reported based on a cutoff grade of 150 grams per ton
  • The cutoff grade could be dropped to 75 grams per ton in a market environment where the Silver to Gold ratio dropped from its current value of 90 to the level reached in 2010 (approximately 30)
  • At a cutoff grade of 75 grams per ton Dolly Varden’s “ounce count goes through the roof”

Research performed at Sedar.com

The legally required filings from publicly-held Canadian mining companies can be found online at the SEDAR website. These documents provide public disclosure which allows investors to dig into the details of how a company is being operated.

The primary documents of interest are the audited Annual Financial Statements and the Management’s Discussion and Analysis reports.

Comparable documents for US companies can be found at the EDGAR website published by the U.S. Securities and Exchange Commission (SEC).

When you are serious about performing due diligence on a company, it is necessary to use these legal filings. Relying on the company to provide this information is not a viable strategy.

Most mining companies prepare and publish investor presentations on their websites but these slide decks are not regulated by any external agency, so they are used to portray the company in the best light possible. To use a crude analogy, the investor presentations often show a pig dressed in fancy clothing and wearing lipstick, while the legal filings require that the pig be presented naked and without makeup.

Because companies are unable to use lipstick in their legal filings, they sometimes do their best to hide and obfuscate potentially damning information in footnotes.

If you choose to dig into these documents, it is necessary to pay close attention to the footnotes in order to get the full scope of the information being presented. A cursory examination that skips over the footnotes is likely to miss significant information.

Doing this analysis is not much fun. It is tedious and time-consuming work. Also, if you are cynical by nature, you may develop a negative impression of a company simply because they made it difficult to analyze their information.

Dolly Varden Silver Stock

Dilution of shares

By digging into multiple years of SEDAR documents we were able to assemble this table showing how outstanding shares of Dolly Varden Silver have grown since the company went public:

Year

Shares Outstanding

% Increase

2018

49,901,528

n/a

2019

68,056,458

36.4

2020

102,790,518

51.0

2021

130,720,286

27.2

2022

214,979,429

64.5

2023

257,129,652

19.6

In the video we explain that this type of share growth is not uncommon with the mining companies. This is true with exploration companies in particular because they have no revenue. The only way they can raise money is by selling additional shares of the company.

Dilution of shares can sometimes explain why the price of an exploration company’s stock remains unchanged or even declines as the company increases their Identified and Inferred resources. While they are finding more ounces in the ground they are also diluting the value of each stock share by issuing additional shares.

In the video we use two different methods to estimate how many shares of Dolly Varden stock will potentially be outstanding by the end of 2024.

Cash burn rate

By digging into several years of the Management’s Discussion and Analysis reports filed on Sedar, we assembled this table showing the rate at which Dolly Varden Silver is burning through cash:

Time period

Burn rate (CAD millions)

Q2, 2024 => Q3, 2023

$27.075

Q1, 2024 => Q2, 2023

$26.462

Q4, 2023 => Q1, 2023

$26.648

Q3, 2023 => Q4, 2022

$25.272

Q2, 2023 => Q3, 2023

$21.617

Q1, 2023 => Q2, 2022

$19.245

Knowing this burn rate, and the growth of the burn rate, is important because it provides insight into the level of share dilution we can expect going forward.

Because an exploration company like Dolly Varden has no choice other than to fund its operating costs by issuing stock shares, the cash burn rate shows us what the dilution rate is likely to be in the future.

As we can see in the table above, DOLLF is burning through $27 million CAD per year. At a share price of $1.02 CAD (as of 09/10/2024), this burn rate means that Dolly Varden Silver will have to issue at least 27 million shares of stock each year just to cover operating costs.

In the video we explain that the growth in burn rate can be explained by two factors:

  • Inflation
  • Steadily increasing levels of compensation to the company’s officers and directors

Compensation levels

In the video we walk through the process of deciphering footnotes to determine the compensation levels of the CEO, CFO, and Technical Director.

We also show how the footnotes demonstrate that these company principles each have personally-owned businesses that are receiving compensation. In other words, each of them receive direct compensation as individuals and they receive further compensation through businesses that they control.

Of most interest is Mr. Khunkhun’s total compensation in 2022, 2023, and the first quarter of 2024. Watch the video to see how a mix of cash and Dolly Varden shares increased from 2022 to 2023 and put the CEO on track for a potential compensation package of $1.6 million CAD in 2024.

Wrapup

In the conclusion of the video, we return to Dolly Varden Silver’s investor presentation and point out that there are major investors who choose to invest in DV. We suggest that these investors have done their own due diligence on the company and choose to remain invested.

Every investor must make their own decisions about putting their hard-earned money into Dolly Varden Silver (or any other mining company) and whether to remain invested after doing so. Hopefully, the deep-dive we have performed here will provide valuable information that investors can use in making these decisions.

Dolly-Varden-Silver-Dilution-of-shares-Cash-burn-rate-Satori-Traders.jpg

Disclaimer: We hold shares in the company and are currently re-evaluating our investment. We may choose to sell our shares at any point, and we have no obligation to notify anyone before doing so.

https://satoritraders.com/blog/dolly-varden-silver-dilution-of-shares-cash-burn-rate/

Tuesday, September 3, 2024

US Stock market news - Wall Street selloff - Satori Traders

US Stock market news - Wall Street selloff

AI-Bubble-Dot-Com-Bubble-Satori-Traders.png

In today’s video we focused on the U. S. stock markets and, in particular, Nvidia and the tech Stocks.

 There was a lot of interesting market action today.

Gold and Silver prices charts

One of the most interesting behaviors was the fact that as the Stock markets sold off, Gold actually rose. The yellow metal was weak in the morning but as the day wore on Gold found support and headed gently higher.

This strong action in Gold is bullish for the Precious metals. The price action doesn't look very bullish on the chart, but relative to what the Stock markets did today, that's fine action in gold.

 Silver doesn’t look as good as Gold, but it did find support along the median line of a Schiff pitchfork and then moved a little higher.

Nasdaq 100 chart

Instead of following through on Thursday and Friday’s bullish action, the Nasdaq index rolled over today and moved 3.15% lower.

In the video we drew attention once again to an open gap above the current price action. This unfilled gap is a sign of weakness in the technology sector, or at least in the Nasdaq 100 Stocks.

In the final hour of trading the index found support at a support resistance zone and bounced a little bit higher.

Other bearish aspects of the Nasdaq chart include rising volume as price declines and a new sell signal from the MACD indicator.

 There are more details in the video.

S&P 500 chart and Dow Jones chart today

The S&P 500 index lost 2.12% today and bounced slightly off the 50-day moving average. Volume increased on the selloff which, again, is bearish.

 The Dow index lost 1.51% to find support along a minor support resistance level. Based on the MACD indicator, DJIA is very overbought and it appears that upward momentum has ended.

Dot Com bubble vs AI bubble

Technology Select Sector SPDR Fund (NYSE Arca: XLK) vs S&P 500 index

One of the most interesting charts shown in today’s video compares the strength of the technology sector (as represented by XLK) to the strength of the overall S&P 500 index.

The chart covers the time span of the late-1990s to today and emphasizes the similarities of the Dot Com bubble of 1999/2000 to the current bubble in technology Stocks which some analysts are calling the AI bubble.

In addition to the similarities in price action between 1999/2000 and today, we pointed out how the narratives in play during each period are very similar.

During the Dot Com bubble the narrative was, “the internet will change everything.” Today, the narrative is, “AI will change everything.”

 Demonstrated very clearly in the chart is how the Dot Com bubble reached a certain level before popping, and that today, the AI bubble is very close to the same level.

Nvidia stock chart

Nvidia Corp. (Nasdaq: NVDA)

Nvidia stock is obviously the key player in the group of AI technology stocks.

In the video we talk about an Energy Coin in the Nvidia price chart. Energy Coils are one of the Technical analysis techniques that Dr. Timothy Morge taught during his seminars on Andrews Pitchforks.

One of the key behaviors of an Energy Coil is that when price exits the Coil it will do so impulsively (i.e., with high energy). This makes sense when we think about an Energy Coil as a consolidation pattern where the Stock is gathering energy for its next move.

While we were expecting Nvidia to exit the Energy Coil and head higher, the exact opposite happened. Nvidia exited the Coil and headed lower. And, just as Dr. Morge taught, Nvidia moved out of the Coil impulsively.

There is a second Technical analysis technique demonstrated in the video. Dr. Morge called it, “Double the Range.”

When price moves in a price channel, we can think of that channel as a range. If we are trading the Stock we can take advantage of the channel and apply our range trading techniques.

 In the video we apply the Double the Range technique to the Nvidia price chart and show how this methodology accurately identified a price target.

Nvidia stock forecast

After Nvidia’s impulsive move downward, it is logical to look for support levels where the Stock may bounce.

 In the video we apply the Fibonacci retracement tool to identify a potential support level. This tool gave us a potential price target and we identified a secondary price target if the first one fails.

Nvidia subpoena from DOJ

After the Stock markets closed, the Department of Justice issued a subpoena to NVIDIA and other companies.

The subpoena indicates that the DOJ is investigating Nvidia for potential violations of antitrust laws.

Based on the price action in Nvidia during today’s session, it appears likely that insiders knew about the upcoming subpoena. We discuss this possibility in the video.

 We also discuss the possibility that investors in AI technology got ahead of themselves and are now stepping back to reconsider their commitments to AI and the related stocks.

UnitedHealth Group stock

UnitedHealth Group Inc. (NYSE: UNH)

UNH is the number one stock in the Dow 30 based on weighting. This Stock is a heavy-hitter which makes up 9.38% of the Dow index.

 The stock made a bullish move today, poking up through resistance and closing there.

Consumer Staples ETF

Consumer Staples Select Sector SPDR Fund (NYSE Arca: XLP)

During our research today we looked at each of the SPDR ETFs that correspond with the main sectors in the S&P 500 index.

We noticed that XLP, the consumer staples ETF, is making new all-time highs which suggests that investors could be moving into more defensive areas of the Stock market.

 This shift to risk-off assets is supported by the bullishness in UNH which is why we shared both of these charts in the video.

Magnificent Seven ETF

Roundhill Magnificent Seven ETF (Nasdaq: MAGS)

We looked at this ETF because it gives us a quick way to look at the overall health of the Magnificent Seven stocks.

And, of course, the Mag 7 and the AI stocks are essentially the same. If we add Google (Nasdaq: GOOG) to the Mag 7, we have all of the major stocks in the AI technology group.

In the video we show that the Magnificent Seven ETF (and therefore the AI stocks) have formed what could be an Island Top pattern which is considered a reliable reversal pattern.

Visa stock price

Visa, Inc. (NYSE: V)

In the Visa price chart we show that the stock has formed a double triple top. You’ll have to watch the video to see what that means.

Caterpillar stock price

Caterpillar, Inc. (NYSE: CAT)

We looked at CAT in the last video analyzing the top 10 Dow index components. 

In today’s video we show the Caterpillar price chart again to demonstrate another advanced Technical analysis technique that Dr. Morge taught.

 Watch the video to learn about Price Magnets and how they influence price action in a stock.

Goldman Sachs stock price

Goldman Sachs Group, Inc. (NYSE: GS)

GS is another stock we looked at in the previous video. It counts for 8.04% of the Dow index so its behavior influences the entire Dow 30 index.

 In today’s video we take another look at the Goldman Sachs price chart because the price action today confirms the triple top pattern that we previously identified.

Wrapup

In the wrapup of today’s video we encouraged investors to think about everything that is going on in the world and how that might affect the Stock markets.

Volatility due to geopolitical events, volatility due to elections, volatility due to events in the tech sector, etc. There are a lot of significant events happening right now and any one of them could have a major impact on an Investment Portfolio.


US-Stock-market-news-Satori-Traders.jpg

As a final point, we emphasized that the technology stocks have been the main driver in recent Stock market strength and that we may be seeing that strength end.

 There are a lot more details in the video – give it a watch for an in-depth look at the US Stock market today, and don’t forget to like and subscribe!

https://satoritraders.com/blog/us-stock-market-news-wall-street-selloff

Friday, August 30, 2024

Nvidia stock price forecast – Price targets - Technical analysis - Satori Traders

Nvidia stock price forecast – Price targets - Technical analysis

In today’s video we followed up on the Nvidia (Nasdaq: NVDA) video from yesterday and the Flag pattern targeting $160. That Flag pattern failed, and today we examined the failure in detail.

Technical analysis Bible

The reference manual for performing Technical analysis is the universally acclaimed, “Technical Analysis of Stock Trends,” by Robert D. Edwards and John Magee. This book was originally published in 1948 and it is widely considered to be the Bible of Technical analysis. Still relevant after 75+ years in print, the manual is currently in its 11th edition.

As part of our examination, we reviewed the characteristics of Flag and pennant patterns and how to use them accurately.

From “Technical Analysis of Stock Trends,” we find these characteristics of a valid Flag and pennant patterns:

  • The Flag pattern will have a nearly vertical or steep pole
  • Volume will decline considerably during the consolidation phase when the Flag or Pennant is being formed
  • The pattern occurs most commonly and is most reliable in uptrends
  • According to the authors, the pattern is "among the fastest and most profitable forms of market action"
  • Before entering a trade based on the pattern, wait for confirmation which is an upside breakout on rising volume
  • Volume will be increasing as the Flag pole is formed
  • Trade entry can be made while the Flag is being formed, but only do so with a tight stop
  • To determine a price target based on the pattern, remember that "the flag flies at half-mast"

Failure of the Nvidia Flag and pennant pattern

After reviewing these characteristics, we re-examined yesterday’s analysis to see where we got it wrong. In the video we examine each of the characteristics of Flag and pennant patterns as they apply to our Nvidia price prediction of $160.

In hindsight it is obvious that we forgot to pay attention to volume during the Flag pole portion of the pattern. Instead of rising, volume in Nvidia stock was actually falling during this period.

And, as we have pointed out in several recent videos, volume action in many equities and the equity indexes as well has been inconsistent with a bull market in stocks. Instead of rising volume as price increases, we're seeing falling volume or flat volume. And that is not bullish.

It’s almost as if the Stock markets are currently floating higher on hype and hopium related to AI technology.

Flag or Pennant vs Energy Coil

I learned Andrews pitchforks methodology from Dr. Timothy Morge, a professional trader and consummate educator. Dr. Morge learned about Andrews pitchforks directly from the creator, Dr. Alan Andrews, and he used the methodology quite profitably throughout his 40-year career.

Dr. Morge never talked about price patterns. He looked at financial markets in terms of what he referred to as market geometry, which includes support and resistance areas, trend lines, price channels, and, of course, Andrews pitchforks. 

He also emphasized the importance of energy and how it relates to price action.

One of his valuable lessons was on what he called Energy Coils. In a Flag and pennant pattern, Dr. Morge would have referred to the Flag portion of the pattern as an Energy Coil.

He taught that during an Energy Coil price is gathering energy for its next move. The name ‘Energy Coil’ came from the idea that as price consolidated, it was winding a coil tighter and tighter.

When the coil releases, the gathered energy will be expressed in impulsive price action.

Dr. Morge pointed out, however, that it is not possible to predict the direction that price will take upon exiting the Energy Coil.

In the Nvidia Flag pattern we can see that price consolidated for nearly two trading weeks before exiting the Flag or Energy Coil.

Instead of breaking to the upside as we had predicted, price broke impulsively to the downside and invalidated the Flag and pennant pattern.

Nvidia stock price forecast

Since the Flag pattern has failed, what we're looking for now is where price might find support during its downward movement.

Watch the video to see how we examine potential support levels and price targets using these techniques:

  • Moving averages
  • Fibonacci retracement levels
  • Round numbers
  • Support and resistance zones

Nvidia earnings report

In their Q2 earnings report, Nvidia actually exceeded analyst forecasts. Usually that serves as a reason for investors and traders to take a stock higher. In this case, however, NVIDIA headed lower after the earnings announcement and company conference call.

TradingView is suggesting is that the markets didn't like the news, or the lack of news, about the upcoming launch of the Nvidia Blackwell chip. There wasn't a lot of detail provided about the challenges that NVIDIA has had and is facing with the Blackwell chip. 

The company just acknowledged that there was rework required, but they still expect to be shipping this chip in Q4 and have several billion dollars worth of revenue from sales of the chip.

Our interpretation of the earnings report and conference call was positive, which gave us confidence in predicting an upside target.  Obviously, the markets reached a different conclusion and took the Nvidia stock price lower.

Some analysts have suggested that investors and traders were so used to Nvidia  earnings totally blowing away analyst expectations, so they were disappointed that Nvidia didn’t tell everybody, “Hey, our stock price is heading to the moon!”

Nasdaq index chart

We concluded today’s video with a quick look at the equity indexes.

The most important behavior, in our opinion, is the fact that Nasdaq left an open gap overhead during its last rally.

Failing to fill this gap is an indication of weakness. Price was not strong enough to fill that gap, and instead, the index rolled over and headed lower.

Watch the video for more in-depth analysis of the Nasdaq index, the S&P 500 index, and, of course, the Dow Jones index.

https://satoritraders.com/blog/nvidia-stock-price-forecast-price-targets


Thursday, August 29, 2024

Nvidia stock price today – Technical analysis - Satori Traders

Nvidia stock price today – Technical analysis

In today’s video we looked at charts of Nvidia (Nasdaq: NVDA) in multiple time frames and then took a quick look at the equity indexes (Nasdaq, S&P 500, Dow).

Nvidia announced earnings today after the market close and the markets seemed hesitant during today’s session while waiting for this big event.

Tomorrow morning, we will have the Jobless Claims report and the markets will most likely react to that. We mention this because tomorrow’s market action in Nvidia may be exaggerated by the reaction to the Claims report.

Nvidia’s earning results pretty much matched the expectations of analysts so we probably won’t see much reaction, either bullish or bearish, based on the earnings results.

If there is anything to be bearish about, it’s the fact that there was nothing exciting in the report or in the company’s conference call. Stock investors who are hyper bullish on NVIDIA stock (and AI tech in general), may have been disappointed by the earnings report because there was nothing to feed their excitement. We might see a little bit of bearishness in the stock if these investors adjust their investments in Nvidia. 

During the conference call there was acknowledgment of the design challenges faced with the Blackwell chip and brief mention of the rework required. Little detail was provided however, and the company is still expecting to begin shipping the new chip in Q4.

Nvidia stock price charts

The most striking attribute about Nvidia in the daily time frame is the flag pattern, which is a continuation pattern. This Technical analysis pattern gives us a price target of about 160,

In the video we also covered Nvidia price charts in the weekly, monthly, and quarterly time frames. All of these charts suggest that the primary trend in NVDA is to the upside. Watch the video to discover Nvidia stock performance in these longer time frames.

Stock market index charts

After examining Nvidia price charts we did a quick overview of the equity markets in the daily time frame.

As we explain in the video, the Nasdaq has an open gap overhead that remains unfilled. Having the market approach this gap and then rollover is a sign of weakness.

One of the common sayings among Technical analysts is, “Price abhors a vacuum.” This saying expresses the idea that gaps act as price magnets and they usually get filled. So again, the fact that this gap remains unfilled is somewhat bearish.

Another bearish indication comes from the Dow price chart where we find a double top. We also pointed out that price has become very overbought based on the MACD indicator.

Take a look at the video for more details on how Nvidia is performing and let us know if you agree with the price target at $160.

https://satoritraders.com/blog/nvidia-stock-price-today

Sunday, August 25, 2024

Gold Stocks - Large market cap - Satori Traders

Gold Stocks - Large  market cap

Gold-stocks-Satori-Traders.jpg

In today’s video we looked at 26 of the largest market cap Gold mining stocks. All of the charts were examined in the monthly time frame.

The best-looking stocks were the royalty companies and streaming companies.

Lundin Gold Inc. (OTC: LUGDF) was by far the best overall stock in the bunch, although it is not a royalty or streaming company.

Lundin-Gold-Inc.png

Lundin Gold has numerous positive factors going for it. The company is in production with positive cashflow and it recently paid off all its debt. On top of these accomplishments, Lundin has some outstanding drill results, an expanded drilling program, and a doubling of its quarterly dividend. The price chart definitely shows the results of all these bullish attributes.

One of the surprising discoveries from researching this set of Gold mining stocks is the actions that the Mexican government is taking towards mining in the country.

There is proposed legislation that would ban new open pit mines. The fact that legislation like this is even being discussed suggests that significant changes could be coming for mining companies operating in Mexico.

In May of 2023, Mexico passed legislation that shortens the duration of mining concessions granted within the country and restricts mining concessions to a single type of mineral.

We will do some research on the ‘single type of mineral’ legislation and report on this change in the future. It will be interesting to see how polymetallic mines (e.g., Copper-Gold, or Copper-Gold-Silver-Tin) will be treated. Does a mining company have to pick one of the metals and ignore the others? Hmmm…

All-in-all, the Gold mining stocks look better than the Silver mining stocks. On the surface that doesn’t seem surprising since Gold has added $700 to its price in the past 12 months. That’s a 38% gain in one year!

Silver has only added $9, but on a percentage basis the white Precious metal gained 45%.

The outperformance of the Gold stocks can most likely be explained by the change in profit margins that occur based on the increased price of the metal.

As a simple example, imagine that we are producing Gold and breaking even on our operation. Then the price of our product goes up by $700 so all of that increase is pure profit.

If we use the same scenario for mining Silver, the price of our product has increased by 45%, but we are only making $9 of profit for each ounce we mine. We need to sell a lot of Silver to match the $700 of profit being made by the Gold producer.

Watch the video to gain insight into the human brain and how it works against us when we invest, why the chart of Lundin Gold looks so good, and why one of the Gold mining companies in today’s set of stocks might be a poor choice.

Gold stocks covered in today's video

Newmont Corp. (NYSE: NEM)

Agnico Eagle Mines Ltd. (NYSE: AEM)

Barrick Gold Corp. (NYSE: GOLD)

Wheaton Precious Metals Corp. (NYSE: WPM)

Franco-Nevada Corp. (NYSE: FNV)

Gold Fields Ltd. (NYSE: GFI)

AngloGold Ashanti PLC (NYSE: AU)

Northern Star Resources Ltd. (OTC: NESRF)

Kinross Gold Corp. (NYSE: KGC)

Royal Gold Inc. (Nasdaq: RGLD)

Alamos Gold Inc. (NYSE: AGI)

Pan American Silver Corp. (NYSE: PAAS)

Harmony Gold Mining Company Ltd. (NYSE: HMY)

Evolution Mining Ltd. (OTC: CAHPF)

Endeavour Mining PLC (OTC: EDVMF)

Fresnillo PLC (OTC: FNLPF)

Lundin Gold Inc. (OTC: LUGDF)

Buenaventura Mining Company Inc. (NYSE: BVN)

Hecla Mining Company (NYSE: HL)

B2Gold Corp (NYSE Arca: BTG)

Eldorado Gold Corp. (NYSE: EGO)

Triple Flag Precious Metals Corp. (NYSE: TFPM)

Osisko Gold Royalties Ltd. (NYSE: OR)

Iamgold Corp. (NYSE: IAG)

Sandstorm Gold Ltd. (NYSE: SAND)

SSR Mining Inc. (Nasdaq: SSRM)

https://satoritraders.com/blog/gold-stocks/

Wednesday, August 21, 2024

Drone stocks - Technical analysis tips - Satori Traders

Drone stocks - Technical analysis tips

In today’s video update I did double-duty:

  1. Analyze a Drone stock (Droneshield - OTC: DRSHF) at the request of a subscriber
  2. Provide Technical analysis tips and strategies by example

The video ended up being much longer than intended (just over an hour), but I was able to show numerous basic and advanced Technical analysis examples.

I was initially surprised to find that several of these Drone stocks started as shell corporations that got renamed and repurposed.

After some thought, it occurred to me that it might make good business sense for a new company to start with a shell corporation that already has a listing on a major index.

Supposedly, the cost of obtaining an exchange listing is prohibitive for most startups. The cost largely involves the effort required to overcome regulatory hurdles.

Most companies desire a Stock exchange listing because it gives them ready access to funding as investors purchase their stock.

And the higher the exchange, the more access to funding. In the junior mining sector, for example, many companies start with a listing on the TSXV, then advance to the TSX, and ultimately, onto the NYSE Arca exchange.

When analyzing companies that start with a shell corporation listing, it isn’t uncommon to find the company performing reverse stock splits as they attempt to make their stock look like a good Investment.

As a conservative investor, renamed shell corporations and reverse stock splits are red flags. There are lots of stocks to invest in – putting hard-earned money into a company with these red flags doesn’t make sense to me.

One of the companies analyzed in the video has performed three reverse splits during its existence (1/150, 1/10, and 1/1200)!

 These are the most common reasons a company performs a reverse stock split:

  1. Prevent the delisting of their stock because the price of the stock falls below a certain threshold. For example, dropping below $1 per share where the stock becomes a penny stock that can only trade with other over-the-counter stocks.
  2. Increase the price of each share of stock. This is simply window-dressing to make the stock look better to investors (i.e., take the stock out of and away from penny stock territory which conservative investors avoid).

In the video I also touched on the dynamics of taking a company public via an IPO (Initial Public Offering).

Quite often, the IPO event is sponsored by an Investment bank and the sponsor takes payment for their services in the form of shares in the sponsored company. These shares typically have a minimum holding period before the sponsor can sell them.

Once the holding period expires, the sponsors are likely to sell their shares in order to get paid for the services that they provided. This selling can negatively affect the price of the stock.

Watch the video for more insight into Drone stocks, Technical analysis tips, and the numerous games that get played with stock listings.

Drone-stocks-Technical-analysis-Satori-Traders.jpg

Drone stocks covered:

  • Droneshield Ltd. (OTC: DRSHF)
  • Unusual Machines, Inc. (NYSE Arca: UMAC)
  • Red Cat Holdings, Inc. (NASDAQ: RCAT)
  • AeroVironment, Inc. (NASDAQ: AVAV)
  • Kratos Defense & Security Solutions, Inc. (NASDAQ: KTOS)
  • Workhorse Group, Inc. (NASDAQ: WKHS)

https://satoritraders.com/blog/drone-stocks-technical-analysis-tips/

Gold IRA vs Gold ETF - Satori Traders

Gold IRA vs Gold ETF To address the topic of “Gold IRA vs Gold ETF,” we can focus on the important difference between paper Investments a...